Proposed by: Jyoti Bhogal
FOSS to Track Sustainable Development Goals
- Speaker Introduction: Jyoti's journey of using Free and Open Source Software started during herBachelor’s degree. R was the first ever programming language she used, making her a late bloomer in the tech space. However, there was no stopping once she got the hang of it. The fact that this software is totally free, helped her - a college student back then, to start programming. The flexibility and community-driven nature of open-source tools helped her ramp up and collaborate.
- Value to Attendees: From this talk, the attendees will gain insights into the intersection of the power of FOSS in driving social good, use of Open Data, data visualization, and environmental sustainability.
- Problem Statement: The United Nations have defined 17 Sustainable Development Goals. In this work, I have focused on Goal 13: Climate Action - Indicator 2, which is to control the emissions of greenhouse gasses (GHG) per year.
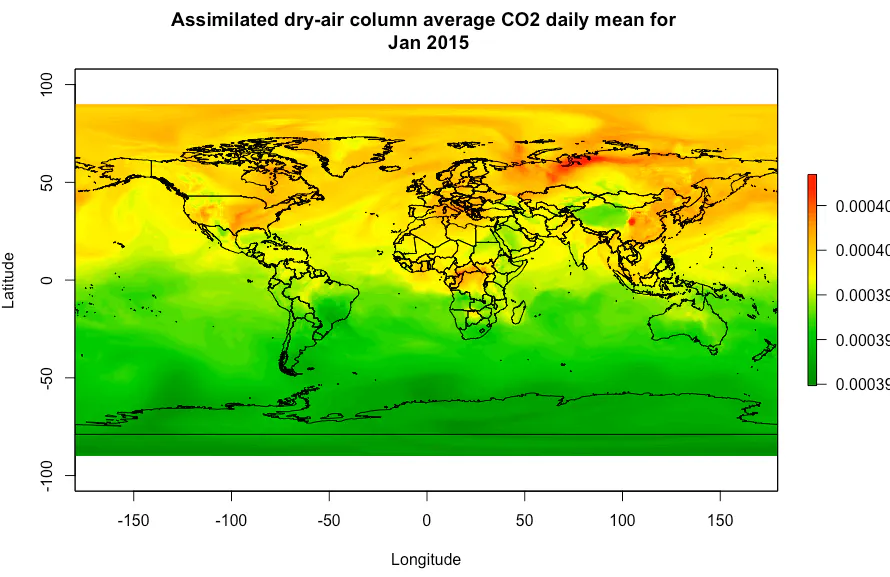
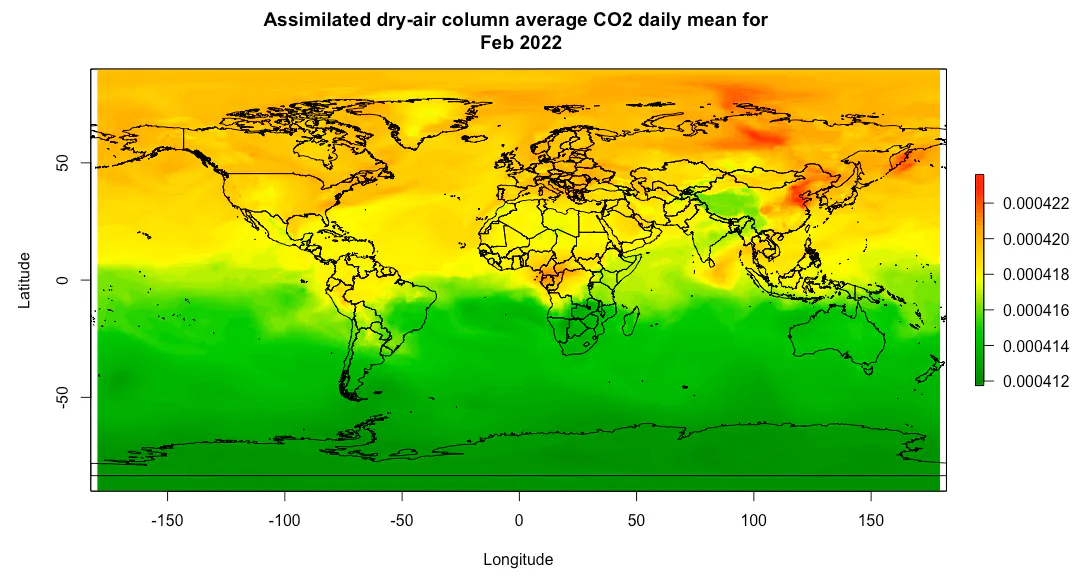
- Dataset: I used free and open data from NASA Earth Observation Data about the daily average values of assimilated CO2. It was recorded by the Orbiting Carbon Observatory-2 (OCO-2) for the duration Jan 2015 through Feb 2022.
- Data Preprocessing: I transformed the data, and created two kinds of data visualization - one is a world map view to see the variations in the different regions. Another one is a user interactive time series plot to see the global trends over time at one glance.
- Key Observation: Following table shows how the global average value has changed over time:
| Time | Global Average CO2 Assimilated |
| Jan 2015 | 390 ppm |
| Feb 2022 | 418 ppm |
Observations/Key Takeaways:
- The average value has increased more than expected.
- Conclusion: Reflecting on total GHG emissions, the progress on Indicator 2, i.e., controlling total GHG emissions per year, seems to fall short of anticipated targets of a 43% reduction in GHG emissions by 2030 starting from 2010, culminating in net-zero emissions by 2050. Looking at the trend, it has increased rather than decreasing. Addressing this shortfall requires not only governmental policies but also individual contributions. Transitioning to green fuel vehicles, re-assessing agricultural practices like Stubble burning, increasing vegetation cover, and embracing recycling and reuse initiatives stand as actionable steps towards a sustainable future.
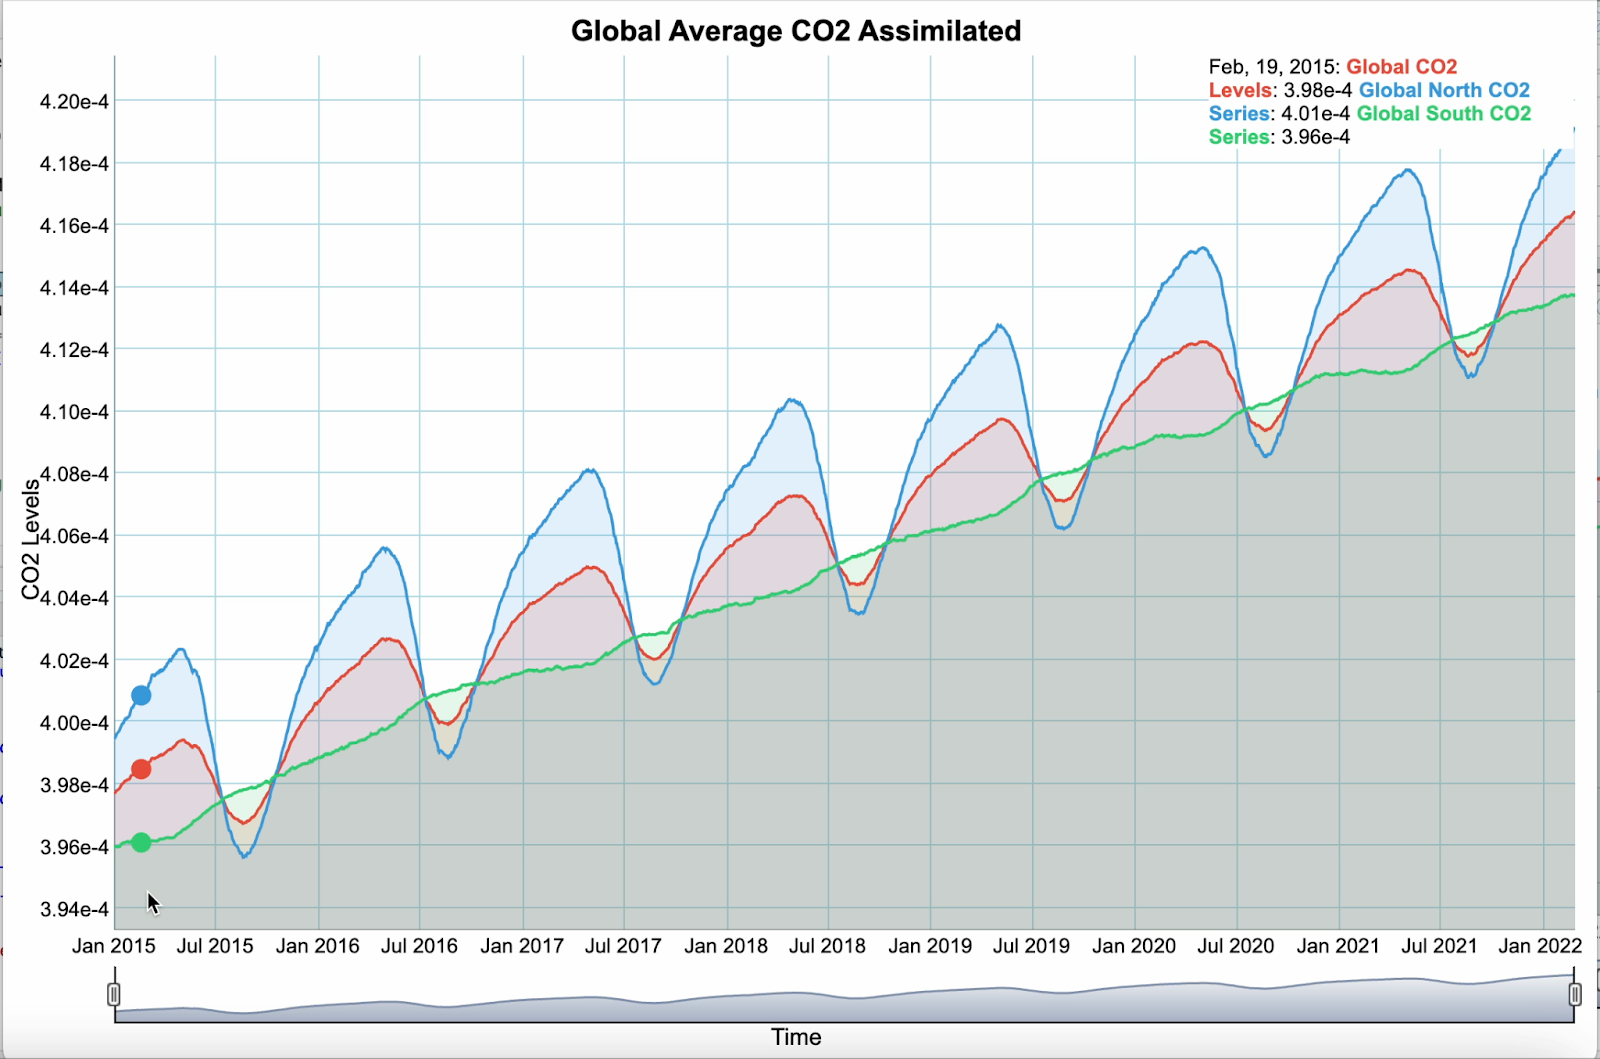
For more details about the code and for using the interactive plots, please check out the video demo of the Time Series of Global Average CO2 Assimilated between 2015 through 2022 .
Source code/Reference: https://www.linkedin.com/in/jyoti-bhogal-a20705163/
Talk duration: